News
Bus Transportation optimization: everything is based on the big data analysis
The “Bus transportation” use case is progressing according to the plan; it has already integrated its workflows onto the Evolve platform. For Real Time (RT) and No Real Time (NRT) contexts the workflows have been already defined and implemented. Several components (i.e. Apache Kafka, Spark, etc.) have been included into the data ingestion processes collecting transit data (bus events, shapefiles, etc.) through the web services implemented by MemEx / Tiemme the public transport company operating in South Tuscany. These data are therefore stored in the Kafka topic. Visualization tools are also being developed and adapted to allow the analysis and identification of critical issues on public and private traffic network. Preliminary KPI results have shown significant business advantages; however, more evaluation results will be extracted within 2021 for this.
1. The Bus Transportation Use Case
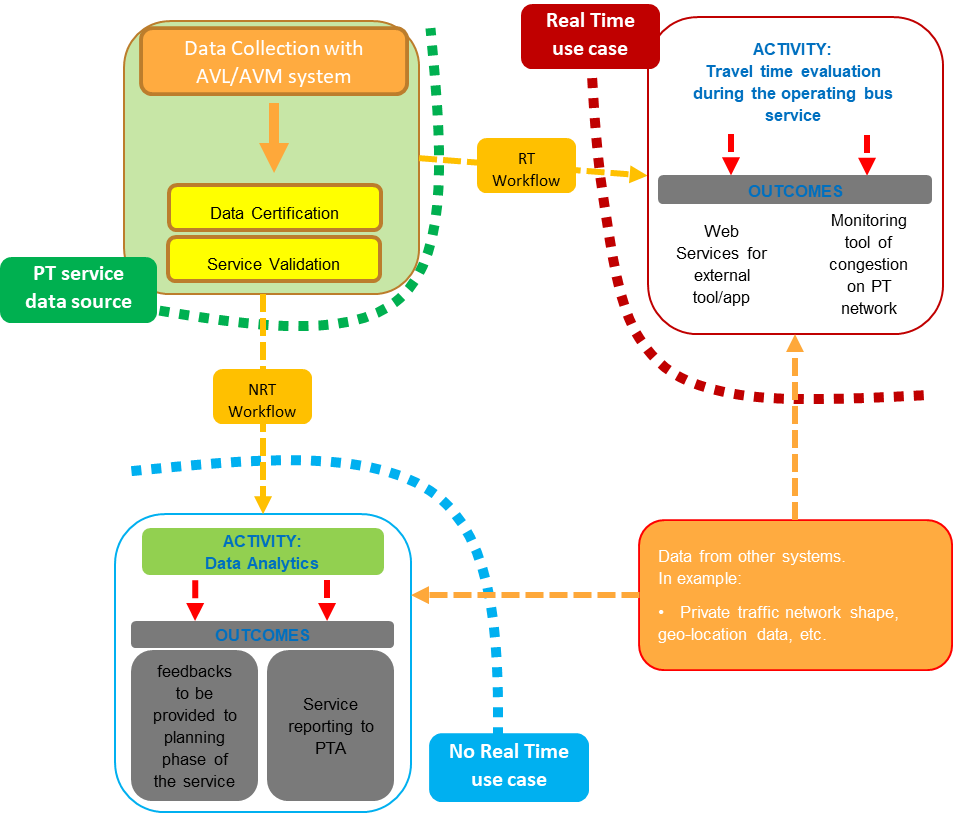
The bus transportation “Use Case” includes two main flows: the “No Real Time - NRT” and the “Real Time - RT” workflows.

Figure 1 – RT and NRT workflows
Main objectives of both RT and NRT contexts are the identification of critical issues related to the Public Transport service and to the private traffic network. These activities were possible before Evolve but were requiring longer running time for processing the data and achieving the planned outcomes.
1.1. The No Real Time workflow
The “NRT” workflow is dedicated to the “historical” data ingestion process into Evolve platform. The needed information are related to the service operated until the day before. These information have to be elaborated, aggregated and linked in order to estimate specific public transport service indicators and to identify potential critical issues on the public transport network. To make it possible, suitable workflow has been designed and implemented in order to collect the required data within the Evolve project. Tiemme. is the data provider for both the case studies (NRT and RT). Tiemme is a Public Transport Company operating the services in South Tuscany-IT (Siena, Arezzo, Grosseto and Val di Cornia) area.

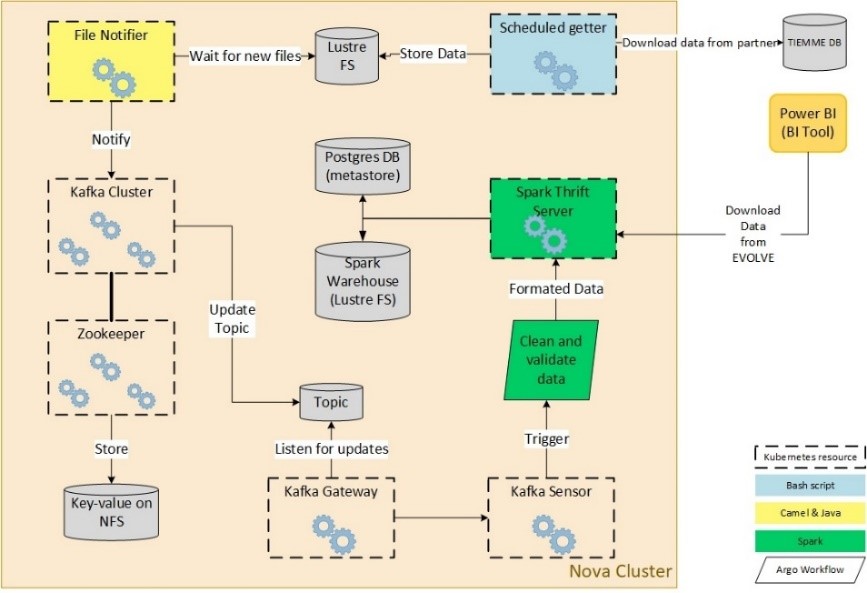
Figure 2 – NRT workflow scheme
In NRT workflow scenario the data are downloaded through specific web services developed by MemEx, from the NOVA platform as JSON files, and ingested in Kafka.
The process for data ingestion can be summarised as following steps:
- Data Retrieval and Ingestion into the platform through the integration and setup of Apache Kafka ingestion on the Evolve platform. The data are downloaded directly on the Evolve cluster.
- Loading files into Spark through the storage of the data in Lustre FS and the metadata in PostgreSQL.
- Applying BI on top of Spark queries allowing s external BI applications (i.e. Power BI) to perform queries against the stored data through Spark Thrift Server infrastructure.
The Kafka Sensor Trigger part uses the Argo Workflow execution runtime, while all the other parts are deployed using the Kubernetes Engine and native resource types.
As abovementioned, the data to ingest for NRT workflow are related to the service operated until the day before and the ingestion process is carried out one time per day. The main data ingested through the implemented workflow are:
- Shapefiles
- Trips list
- Transits time list
- Historical bus events
The implementation of the workflow for data ingestion on Evolve platform allowed to reduce the time required for data elaboration and make possible to analyse and manage data for longer periods. Main scope of NRT workflow is to provide the required data in order to analyse and identify critical issues affecting PT service using specific BI tool. To evaluate the benefits obtained by Evolve project, some preliminary KPIs have been defined and elaborated as the following ones:
- Listing of trips operated in a specific time period with the identification of relevant bus events:
- Before -> 20 minutes were necessary to extract 86K records from SQL DB
- Now -> the same query runs on Evolve platform in less than one minute
- Length of the time period to be analyzed through Power Bi Tool:
- Before -> extension of 1 month
- Now -> more than 12 months with shorter running time
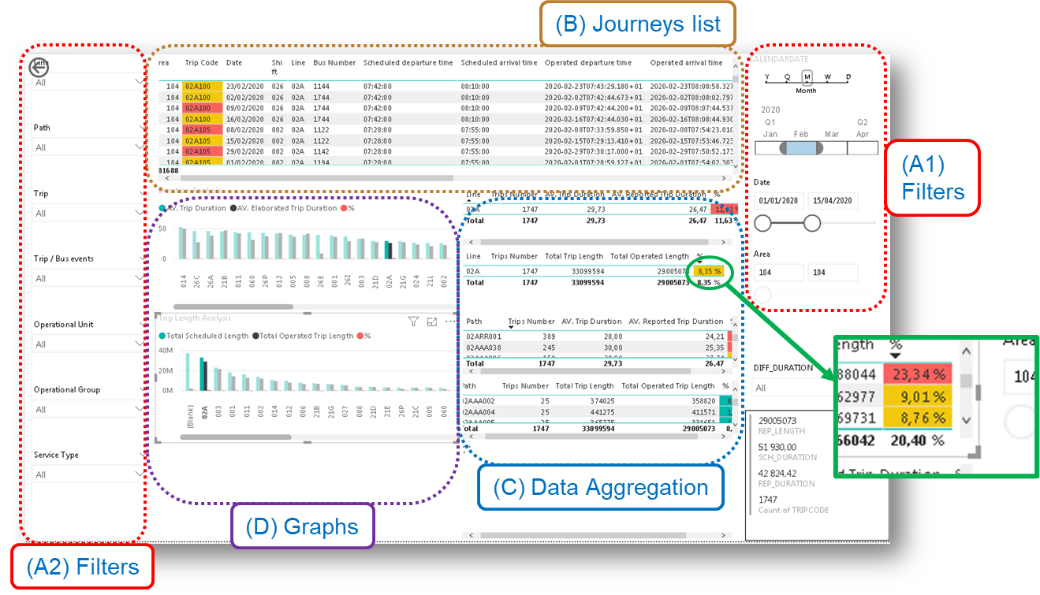
The visualization tool allows to manage the information and set the parameters for the data aggregation and analysis activities.

Figure 3 – visualization tool screenshot
1.2. The Real Time workflow
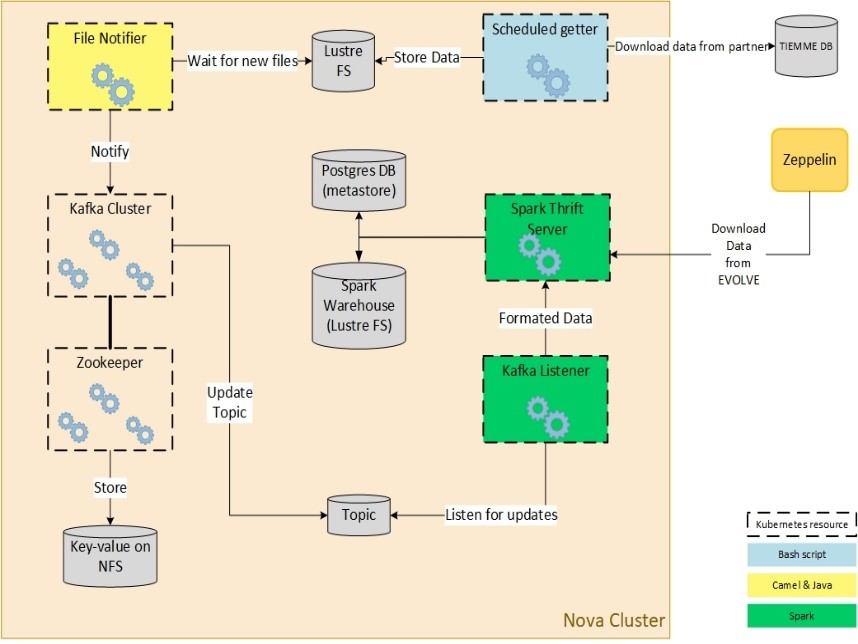
The “RT” workflow is based on continuous data stream format as method for collecting the transit data and allowing the processing. For this purpose, two frameworks, Apache Kafka and Apache Spark are being used. Apache Kafka is used as a streaming data pipeline to reliably transfer the data to consumers, represented by Spark, which offers “Structured Streaming”, a streaming library built on the Spark SQL engine to apply any SQL query or Scala operations on streaming data.

Figure 4 – RT workflow scheme
Concerning the RT context, the Public Transport data are generated continuously and are added to the stream in small batches after a short time. The stream has to be sequentially processed to meet the requirements of a continuous real-time processing. The output of this process is again provided in a continuous data stream format.
For the specific implemented workflow concerning the RT context, the data are downloaded through the MemEx web service (developed on behalf of the transport operator) to the Evolve platform in JSON files that are ingested into Kafka.
The JSON contents are transferred to Kafka and stored as messages connecting a Spark application and receiving data every minute in stream format. The data are then processed in order to filter out the significant bus events and to identify the level of “traffic congestion” on private and public transport network. This level is elaborated on the basis of the travel time, distance covered and detected speed of each bus. The significant bus events will be used to estimate the traffic congestion level and represented/displayed through dedicated visualization tool. For this last step a closed cooperation among the partners has been set up (in particular MemEx, Tiemme, Neurocom and WebLyzard). The output of this process again will be stored in another Kafka topic allowing queries through the visualization application.
To evaluate the benefits preliminary KPIs have been defined and elaborated:
- number of network components (arcs) simultaneously visualized on the map with related information;
- selecting the same number network components (i.e. selection of two or three lines/ routes) running time required to complete the visualization procedure on the map of the overall information.
