News
Anomaly detection in time-series data on Automotive Services
A frequent problem in the development of data-driven automotive services is the detection of patterns in time-series representing physical realities (e.g., camera sensors, cylinder pressures, speeds, locations, temperature, vibration). Clustering and detection of anomalies in such datasets is a demanding challenge that needs significant computational resources. Recently robust approaches have been developed that employ pattern detection methodologies. These approaches offer the advantage that the time series data points are completely agnostic, i.e., the employed decision procedures exploit the patterns but do not make any assumptions about the physical meaning of the underlying signals (e.g., knowledge of first principles, assumption hidden in statistical methods etc.). These characteristics are of importance when we consider (near) real time data processing as a prerequisite for detecting anomalies before a major defect occurs. To illustrate the major concepts for time-series pattern detection, we consider the cylinder pressure of a combustion engine. This is an important information source as it contains information about all components and their condition, which are directly linked to the combustion chamber (e.g. injection system, piston, liner, exhaust valve, fuel). In combination with other engine operation data and by using dedicated algorithms operating on time-series data it is possible to detect numerous fault symptoms and respective root cause information. In this article we discuss the main entities of our pilot workload and present first empirical results on running times for anomaly detection obtained on EVOLVE’s NOVA cluster.
1. Introduction
Recent developments in computer science has allowed the accumulation of vast amounts of data from the industry. Artificial Intelligence (AI) and more specifically Machine Learning (ML) has become a fundamental concept in powertrain industry for the development of advanced data analytics methodologies in contrast to standard thermodynamics approaches. Companies invest in infrastructure to develop new methodologies for almost real time condition monitoring systems.
Trying to bypass the standard overfitting problem of problem specific algorithms, which replicate known solutions, the early development of ML systems though unveiled some of the most common problems of machine learning algorithms. From the one hand, supervised algorithms need significant amount of labeled information and, therefore, investment of large effort to categorize collected data. From the other hand, unsupervised algorithms are difficult to be implemented because of, e.g., the lack of correctly and systematically recorded historical data.
Despite the obstacles, in computer science the simplest solution usually is the transformation of a problem to another already solved. For the case of condition monitoring in powertrain industry an example is the time series analysis, which is a well-known problem in many fields and has addressed successfully in the past from computer science. The standard approach of thermodynamics and statistics to solve such problems can produced very specific solutions to very specific problems with no degrees of freedom, usually highly overfitted and, moreover, without any flexibility or possible adaptation to any change. The main reason of such problems is that we try to describe multi-dimensional, large datasets (time series) with just few parameters or data points. For example, by analyzing a cylinder pressure curve we may use only few parameters derived from it, such as maximum pressure, crank angle at 90% maximum pressure, etc. Additionally, such parameters are highly correlated and a dimensionality reduction analysis such as SVD, PCA, etc. could possibly end with just one or two parameters out of hundreds.
On the contrary, in computer science this is frequent problem and it is addressed by trying to analyze the time series and their curve representation as a complete dataset. However, clustering a high dimensional dataset can be an extremely difficult problem that needs significant resources and cannot be solved by brute-force algorithms. For this reason, many algorithms for clustering have been developed in the past few years having noteworthy differences in their approaches [1], [2], [3]. Mainly there exist three different types of algorithms based on (a) similarity measures, (b) data point temporal proximity and (c) subsequence clustering [1], [2].
Additional approaches have been presented recently and have as their innovative characteristic the pattern detection [7], [8]. These methodologies handle time series data points in a completely agnostic way, i.e., they do not care about the lower level of information and what they represent rather than we care only about patterns, repeated or not, that may or may not exist. For such purposes of pattern detection, state-of-the-art algorithms and data structures exist that allow us to achieve extraordinary results with limited resources both from time and space perspective [4], [4], [6], [7]. Especially the ability to be both time and space efficient is of extreme importance when we deal with real time data streaming and data analytics. When the pattern detection phase has been competed, then we try to determine the domain specific connotation and possible correlations of these patterns.
2. Problem Definition
The AVL EPOS.CoMTM Condition Monitoring system is a system for the unconditional and continuous monitoring of operating engines [9]. A very important subsystem is the Sensor Fault System that monitors the condition of the sensors collecting the data. The importance of the system is obvious since any problem in the sensors that it cannot be detected it could lead to a mechanical failure without the possibility to detect any early warning signals and with catastrophic results for the engine. Therefore, it is absolutely essential to have a robust, efficient and accurate sensor fault system.
3. Methodology
A new pattern detection approach has been used extensively for sensor fault detection. Detecting any possible sensor failure is very important because erroneous data used for evaluating the engine condition could lead to a disaster of the engine [9]. A condition monitoring system is not allowed to be fed with information that does not represent as precisely as possible the engine condition [9]. Therefore, immediate detection of any possible deviation from the accurate data, because of a sensor fault, is fundamental.
For the described methodology here, a sensor fault includes both failures of the sensor itself as well as the subsequent processing of the sensor signal, e.g., any possible abnormalities in engine operation. More specifically, the sensor signal can be described from sections of the cylinder pressure curve with distinct behavior such as it is either stable (or with very small fluctuation due to noise) or has a significant deviation from the expected normal behavior that cannot be described by any thermodynamic law. For example, in Figure 1 we can observe that although the measured cylinder pressure curve follows with significant accuracy a predefined reference curve, there is a small region in [-30, 45] crank angle degrees where the signal is stable or actually has very small fluctuations due to noise. Another case of sensor fault can be examined in Figure 2.a. In this case there is a significant deviation from the reference curve in the range [-360, -180] crank angle degrees for most of the cycles recorded. This deviation is an early warning of the sensor fault and wrong values has been recorded in the whole cycle. Another problem has been recorded in Figure 2.b where there is continuous and wide fluctuation because of high noise in the values, possibly because of a contact problem of the sensor cabling attached to the system.
![Sensor fault in the section [-30 ,45] crank angle degrees Sensor fault in the section [-30 ,45] crank angle degrees](/imagem/avl1.png)
Figure 1. Sensor fault in the section [-30 ,45] crank angle degrees
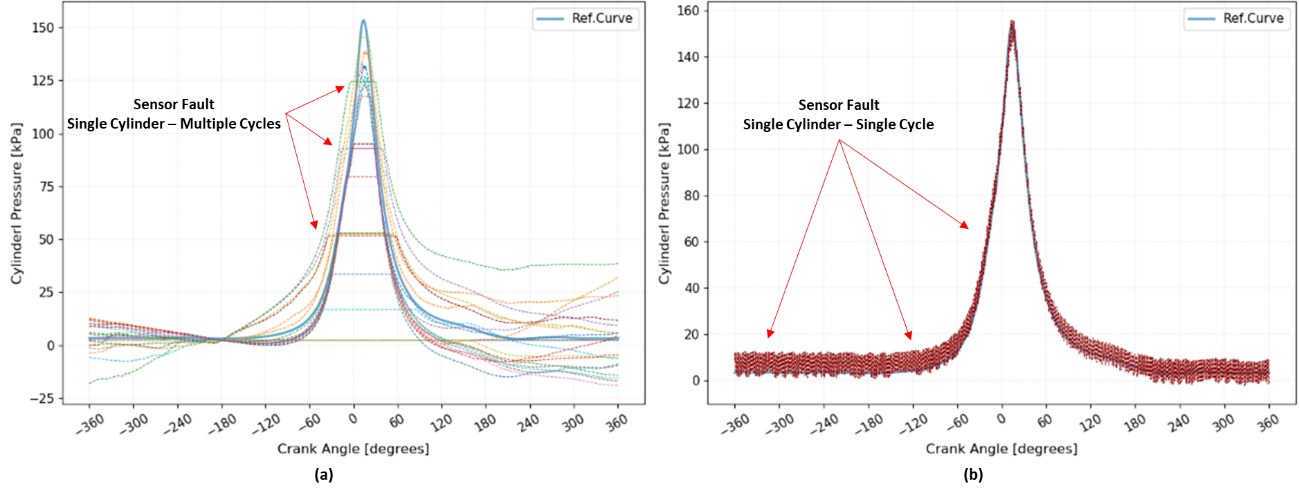
Figure 2. Measurements with sensor fault (a) and noise (b) in the full cycle
On most cases these kinds of faults can be detected by standard thermodynamics and physics approaches. AVL EPOS.CoMTM uses for first time an advanced data analytics approach with foundations on pattern detection and data analytics. Based on this new methodology the system can first classify each cycle recorded using a computed reference curve. If the cylinder pressure curve deviates above a threshold from the reference curve, then the system performs an extensive analysis to identify the possible cause of this abnormality. The results are presented on screen and can visualize easily either a possible sensor fault or a deviation from the normal reference which cannot be characterized as a critical problem in real time but needs further examination by the engine operator (Figure 3). In case of a critical problem an alert can be raised to notify the engineers that immediate actions should be performed to protect the engine.
The methodology to address the sensor fault problem can be briefly described as follows. The first phase of pattern detection analysis is the discretization of the recorded cylinder pressure time series from a sequence of continuous values (real numbers) to a new discrete sequence. Then the sequence is compared to the predefined reference cylinder pressure curve using the pattern detection algorithm. The reference curve has been created based on previous measurements that are known to be correct and describe as an “ideal state” condition of the engine. The reference curve is a relative measure of similarity. If the newly recorded cylinder pressure curve deviates significantly from the reference curve, then the system runs a series of checks to determine why this deviation occurred and tries to classify the error based on predefined and labeled cases. Accordingly, an alert is raised to the engine operator to inform which types of problems have been detected, by presenting the corresponding fault codes. If the problem is critical and immediate actions should be taken, then codes are marked with a red flag (Figure 3, red alerts). Otherwise, if it is a non-sensor fault that it should be further examined in combination with other parameters and sub-systems, then a yellow flag is raised (Figure 3, yellow alerts).
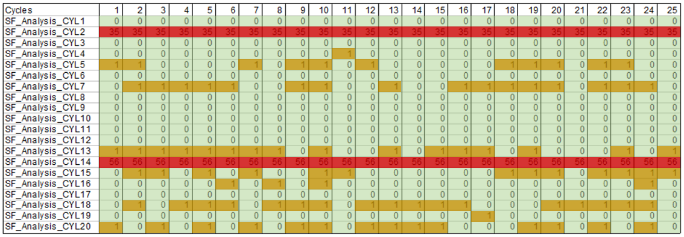
Figure 3. AVL EPOS.CoMTM sensor fault visualization report
4. Analysis pipeline and workload decomposition
EPOS system initially has been designed as a serial, single threaded sequential execution process to be used on engineer’s personal computer (laptop). It takes as input a cylinder pressure measurement of several cycles from multiple cylinder engine. The EPOS time-series analysis tasks can be broken down into independently executable units. To execute the EPOS workflow on NOVA platform we have (1) ported the system to Linux OS, (2) eliminated dependencies by substituting some libraries and (3) compiled the code locally due to IP and confidentiality issues.
Relying on this decomposition, we executed the compiled EPOS code on the NOVA platform in parallel based on the total number of engine cylinders. We employed the Argo workflow engine for Kubernetes to execute the independently executable units. Figure 4 illustrates the execution workflow of the fully parallelized application. Node that every node in the graph corresponds to analysis of a single cylinder. Figure 5 captures the variability of the execution times when it comes to analyzing the 20-cylinder engine.

Figure 4: Fully parallelized execution anomaly detection workflow.
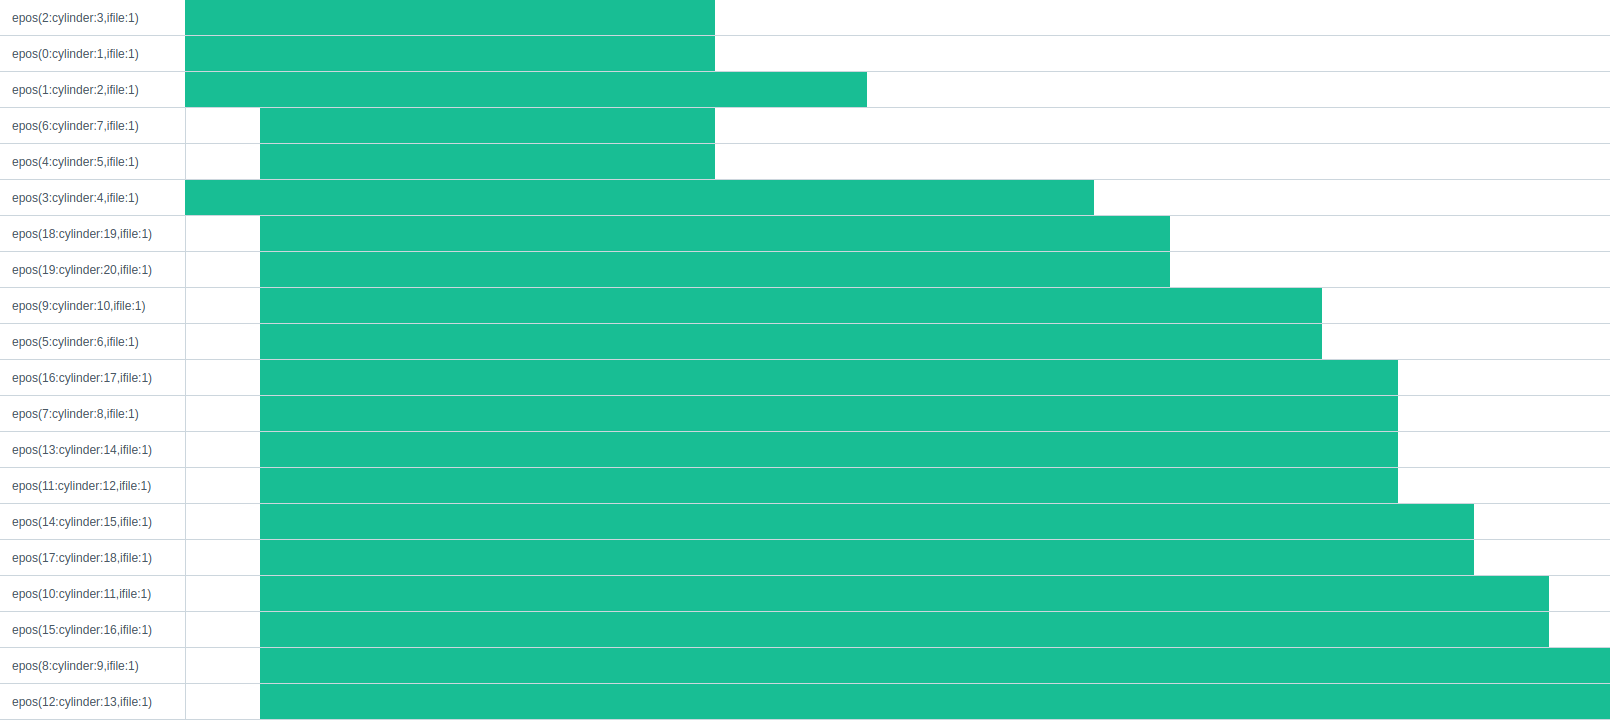
Figure 5: Variability in execution times, green bar denotes the time execution time needed to analyze the corresponding cylinder.
5. First empirical results on NOVA Cluster
Table 1 provides a description of the first results on executing the EPOS workload on the NOVA platform compared to the baseline. The baseline is defined in terms of our highly optimized serial execution on a company workstation. The table reports first preliminary results that are subject of analysis and optimization. Figure 6 provides a graphical overview on the most important KPIs.
Table 1: First results on the execution time obtained on NOVA cluster: Key Performance Indicators (KPIs), KPI definition and level of achievement on the NOVA cluster
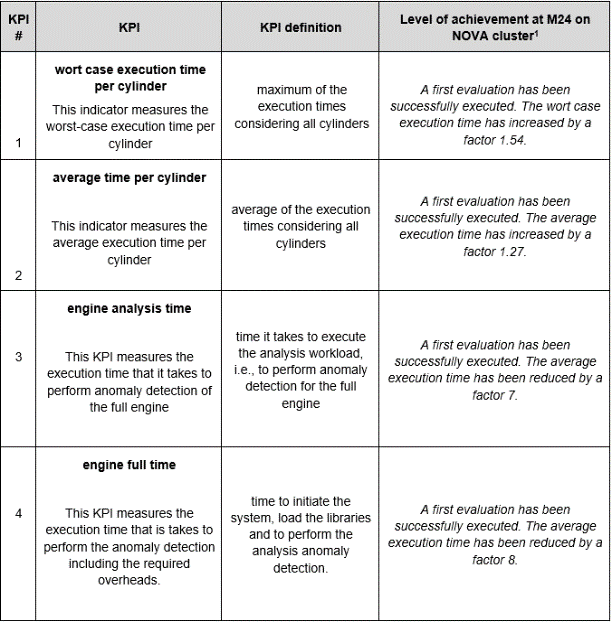
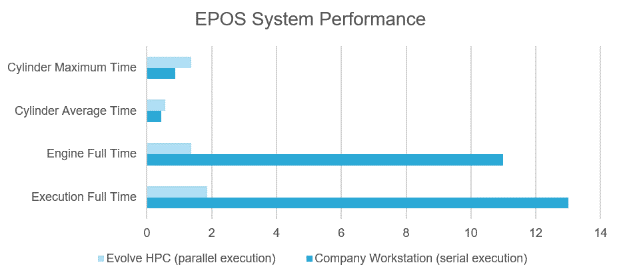
Figure 6: Summary of system performance on NOVA cluster (EPOS), time is seconds.
6. Acknowledgement
This work has been partially funded from the European Union's Horizon 2020 research and innovation programme under grant agreement no 82506.
References
[1] Aghabozorgi, S., Shirkhorsidi, A.S. and Wah, T.Y. 2015. Time-series clustering - A decade review. Information Systems Journal, 53: 16-38.
[2] Bagnall, A., Lines, J., Bostrom, A., Large, J. and Keogh, E. 2017. The great time series classification bake off: a review and experimental evaluation of recent algorithmic advances. Data Mining and Knowledge Discovery, 31: 606-660
[3] Rai, P. and Singh, S. 2010. A survey of clustering techniques, International Journal of Computer Applications, 7: 1-5
[4] Strasser, R., Hrauda, G., Wurzenberger, J., Roduner C. and Valero-Bertrand, D. 2015. XiL-Application and Model-Based Development for Large Engines – The Future?, 15th Conference “The Working Process of the Internal Combustion Engine”, Graz, Austria.
[5] Xylogiannopoulos, K.F., Karampelas, P. and Alhajj, R. 2014. Analyzing Very Large Time Series Using Suffix Arrays, Applied Intelligence,41(3): 941-955.
[6] Xylogiannopoulos, K.F., Karampelas, P. and Alhajj, R. 2016. Repeated patterns detection in big data using classification and parallelism on LERP reduced suffix arrays, Applied Intelligence,45(3): 567-597.
[7] Xylogiannopoulos, K.F. 2017. Data structures, algorithms and applications for big data analytics: single, multiple and all repeated patterns detection in discrete sequences, University of Calgary, Library and Archives Canada, AB, Canada.
[8] Xylogiannopoulos, K.F. 2018. From Data Points to Data Curves: A New Approach on Big Data Curves Clustering, Proceedings of International Conference on Advances in Social Networks Analysis and Mining (ASONAM), Barcelona, Spain. 1-4
[9] Teichmann, R., Abart, M., Mohr, H., Xylogiannopoulos, K., Przymusinski, A., 2019 The Future of Condition Monitoring of Large Engines – Towards Digitalization, Big Data Tools, Cloud Intelligence and Digital Twins, CIMAC, Vancouver, Canada
